F9) Wie wird eine Sturmflut vorhergesagt?
zusammengestellt von der Sturmflutabteilung des NHC
Der deutschsprachige Text wird noch bearbeitet.
Das Modell für Meer-, See- und Landfluten aus Hurrikans (Sea, Lake, and Overland Surges from Hurricanes = SLOSH) ist das Computermodell des amerikanischen Wetterdienstes (National Oceanic and Atmospheric Administration = NOAA) für die Risikobewertung von Küstenüberschwemmungen und für die operationelle Vorhersage von Sturmfluten.
Die Ostküste und die Golfküste der Vereinigten Staaten, Puerto Rico, die Bahamas, die Virgin Islands und Hawaii sind in insgesamt 39 Regionen bzw. Seegebiete unterteilt. Diese Bereiche stellen Küstenabschnitte mit besonderen Merkmalen dar: Buchten, Ballungszentren, tief liegende Bereiche und Häfen. Das SLOSH-Modell berechnet die maximalen Auswirkungen des Sturms, basierend auf die Stärke des Sturms, die Zugbahn und Abschätzungen des NHC über die Ausmaße des Sturms.

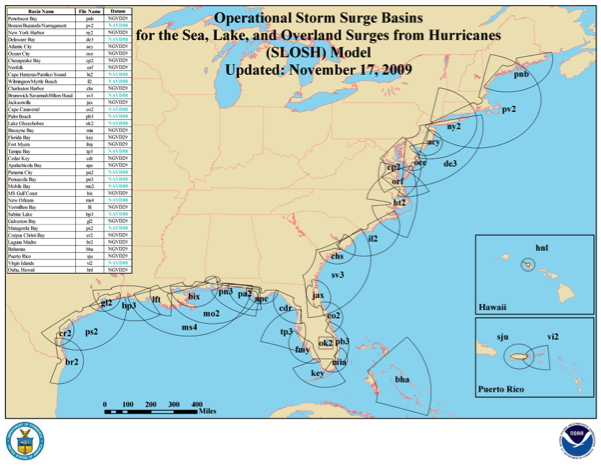
Abdeckung des SLOSH-Modells
Derzeit werden pro Jahr durchschnittlich sechs SLOSH-Regionen überarbeitet. Solche Updates werden letrztlich durch das Interagency
Coordinating Committee on Hurricanes (ICCOH) gesteuert. Das ICCOH verwaltet Analysen der Gefährdung und nach einem Sturm für die Hurricane Evacuation Studies unter dem Hurricane Programm der FEMA. Updates sind nötig, wenn sich die Topografie bzw. Meerestiefe, der Grad der Verwundbarkeit gegenüber Sturmfluten, die Verfügbarkeit von Daten, Veränderungen an der Küste und der Neubau von Hochwasserschutzbauten (z.B. Deichen) verändern.
Manchmal beinhalten die Updates eine höhere Auflösung, um die Darstellung der Sturmflut zu verbessern, eine größere Gebietsabdeckung, um die Genauigkeit der Zugbahnen zu verbessern, eine Umstellung auf vertical reference
datums, and including the latest topography or bathymetric data for better
representation of barrier, gaps, passes, and other local features.
The SLOSH model can generate sevel different products :
- Deterministic runs
This is an operational product based on the official NHC track and
intensity forecast of a tropical cyclone. Operational SLOSH runs are
generated whenever a hurricane warning is issued, approximately 36 hours
prior to arrival of tropical storm winds. It is run every 6 hours
coinciding with the full advisory package. This is a single run product
which can result in uncertainty because it is STRONGLY dependent on the
accuracy of the storm track and timing. This product is intended to
provide valuable surge information in support of rescue and recovery efforts.
- Probabilistic runs (P-surge)
This is a graphical product using an ensemble of many SLOSH runs to
create a Probabilistic Storm Surge (P-Surge) product. This is intended
to be used operationally so it is based on NHC's official advisory. P-Surge
uses SLOSH-based simulations which are based on statistics of past performance
of the advisories. These different SLOSH simulations are based on the
distribution of :
- Cross-track error (impacts landfall location)
- Along-track error (impacts foreward speed and timing)
- Intensity error (impacts pressure)
- Size error (impacts size)
P-Surge is available whenever a hurricane watch or warning is in effect. It
is posted on the NHC webpage within approximately 30 minutes after the
advisory release time.

Example of P-Surge output
- Maximum Envelope of Water (MEOW) runs
This is an ensemble product representing the maximum height of storm surge
water in a given basin grid cell using hypothetical storms run with the same:
- Category (intensity)
- Foreward speed
- Storm trajectory
- Initial tide level
Internally a number of parallel SLOSH runs with same intensity, forward speed,
storm trajectory, and initial tide level are performed for the basin. The
only difference in runs is that each is conducted at some distance to the left
or right of the main track (typically at the center of the grid). Each
component run computes a storm surge value for each grid cell. For example,
five parallel runs may yield storm surge values of 4.1, 7.1, 5.3, 6.3, and 3.8
feet. In this case, the MEOW for the cell is 7.1 ft. It is unknown (to the
user) which track generated the MEOW for a particular cell, so it is entirely
possible that the MEOW values for adjacent cells may have come from different
runs. MEOWs are used to incorporate the uncertainties associated with a
given forecast and help eliminate the possibility that a critical storm track
will be missed in which extreme storm surge values are generated.
MEOWs provide a worst case scenario for a particular category, forward
speed, storm trajectory, and initial tide level incorporating uncertainty in
forecast landfall location. The results are typically generated from
several thousand SLOSH runs for each basin. Over 80 MEOWs have been generated
for some basins. This product provides useful information aiding in hurricane
evacuation planning.

Example of MEOW output
(NNW;Cat 3;20 mph;High Tide)
Each parallel line represents a different track used in the creation
of this MEOW
- Maximum of MEOW (MOM) runs
This is an ensemble product of maximum storm surge heights for all
hurricanes of a given category regardless of forward speed, storm trajectory,
landfall location, etc.. MOMs are created internally by pooling all the MEOWs
for a given basin, separated by category and tide level (zero/high), and
selecting the MEOW with the greatest storm surge value for each basin grid cell
regardless of the forward speed, storm trajectory, landfall location, etc.
This procedure is done for each category of storm. Essentially, there is 1
MOM per storm category and tide level (zero/high). MOMs represent the worst
case scenario for a given category of storm under "perfect" storm conditions.
The MOMs provide useful information aiding in hurricane evacuation
planning and are also used to develop the nation's evauation zones.

Example of Cat 3 MOM output
Strengths and limitations of SLOSH
The SLOSH model is computationally efficient resulting in fast computer runs.
It is able to resolve flow through barriers, gaps, and passes and models
deep passes between bodies of water. It also resolves inland inundation
and the overtopping of barrier systems, levees, and roads. It can even
resolve coastal reflections of surges such as coastally trapped Kelvin
waves. However it does not model the impacts of waves on top of the surge,
account for normal river flow or rain flooding, nor does it explicitly
model the astromical tide (although operational runs can be run with
different water level anomalies to model conditions at the onset of operational
runs).
Zuletzt überarbeitet am 14. Mai 2010
Zurück zur FAQ-Startseite | Zurück zur Hurrikanseite von Thomas Sävert
|